Data
Pulse
A live world events dashboard: earthquakes, wildfires, storms and news on a 3D globe, with a daily AI brief and watchlist alerts.
By ysohaarshAdded 1 hour ago · no reviews yet
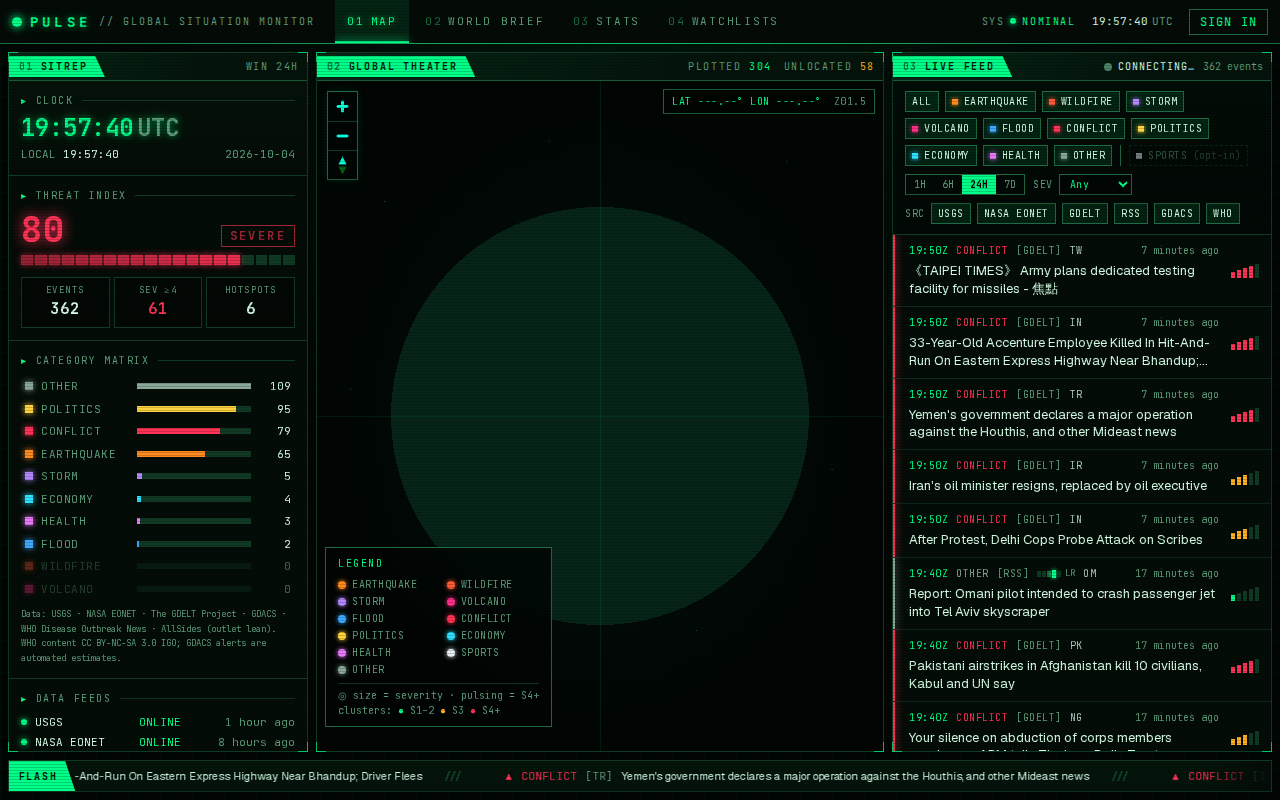
A real-time world events dashboard in a green-on-black "control room" style: earthquakes, wildfires, storms, volcanoes and world news, plotted live on a 3D globe, with a daily AI World Brief and personal watchlist alerts.
Inspired by koala73/worldmonitor. Built end to end with Claude Code, using parallel sub-agents in separate git worktrees.
Features
- 3D globe (MapLibre GL globe projection) that flattens into a street-level map as you zoom; clusters colored by severity, pulsing markers for severity 4+, fly-to, cursor lat/long readout
- Live feed over Supabase Realtime: new events appear without a refresh; filters for category, source, severity and time window live in the URL
- SITREP panel: UTC clock, threat index, category matrix, data-feed status, hotspots, priority traffic
- Stats: events over time, by category, country, source and severity
- World Brief: a daily summary written by any OpenAI-compatible LLM, with an automatic extractive fallback when no key is set
- Accounts, watchlists and alerts: email/password or magic link; a Postgres trigger creates alerts when new events match your watchlists
Data sources include USGS Earthquakes, NASA EONET, The GDELT Project, GDACS disaster alerts, WHO Disease Outbreak News and world news RSS feeds.