HN Attention Cliff
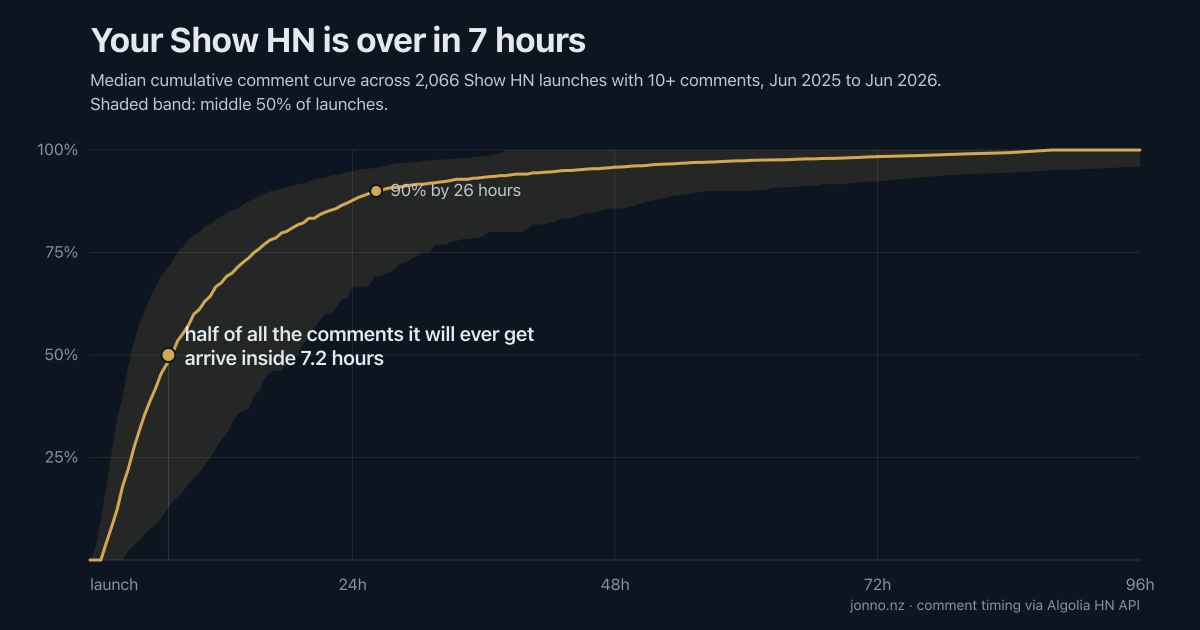
I measured 41,301 Show HN launches: half the comments ever arrive within 7.2 hours
hn-attention-cliff
How fast does attention die after a Show HN launch? This repo measures it:
every Show HN post from a full year, plus the complete comment tree of every
launch that got at least 10 comments, scraped from the
Algolia HN API and reduced to a handful of
uncomfortable numbers.
Written up at
jonno.nz.
Reproduce every number
make reproduceThat runs analyze.py (recomputes results.json from the CSVs in data/,
which are included in the repo) and charts.py (regenerates the four SVGs incharts/). No dependencies beyond Python 3 stdlib. No network access.
To rebuild the dataset from scratch instead of using the included CSVs:
make scrape # ~40 min cold, resumable, <3 req/s against the Algolia HN APIHeadline numbers
| Stat | Value | Function |
|---|---|---|
| Show HN posts, Jun 2025 - Jun 2026 | 41,301 | scrape.fetch_stories |
| Median outcome | 2 points, 0 comments | analyze.all_posts_outcomes |
| Launches with one comment or none | 78.9% | analyze.all_posts_outcomes |
| Hours to 50% of lifetime comments (median launch) | 7.17 | analyze.half_life |
| Hours to 90% | 26.17 | analyze.half_life |
| Lifetime comments arriving after hour 48 (median) | 4.2% | analyze.tail_share |
| Top-decile launches vs the rest | same cliff (7.6h vs 7.1h to 50%) | analyze.cohort_split |
Every stat quoted in the post maps to one function in analyze.py, and every
headline number is recomputed a second, independent way (the *_check keys inresults.json).
Methodology
Corpus. Every story tagged show_hn on the Algolia HN API with a creation
time between 2025-06-18 and 2026-06-18 (UTC). The window ends two weeks before
the scrape date so every story has at least 14 days of comment history.
Attention proxy. HN does not publish vote timestamps, so comment timing is
the proxy for attention. A story's "lifetime comments" are the live comments
posted within 336 hours (14 days) of submission. Decay curves are cumulative
shares of that lifetime total, so slow-burn stories are not penalised by the
cap in shape terms; the cap itself is a stated limitation.
Deep subset. Comment trees are fetched for stories reporting >= 10
comments, and decay stats use stories with >= 10 live in-window comments.
Everything about the distribution of outcomes uses the full corpus.
Caveats, plainly:
- Comments are not votes and neither is traffic. Public traffic reports
suggest traffic decays even faster than comments.
- The decay curves describe launches that got traction (>= 10 comments,
about 5% of the corpus). The median launch never has enough comments
to have a measurable decay curve at all.
- The Algolia API excludes flagged/dead stories and deleted comments, so the
corpus undercounts failures, which makes the medians optimistic.
- HN's second-chance pool re-timestamps a small number of stories, which can
make comments appear to predate their story; those comments are dropped and
counted (sanity.negative_hour_comments_dropped).
- Author replies in their own thread count as comments (19% of all
comments); excluding them moves the half-life by four minutes (see
sanity.median_t50_excluding_author_comments_check).
Files
| File | Purpose |
|---|---|
| scrape.py | Resumable scraper (stories + comment trees, disk cache) |
| analyze.py | Every stat in the post, one function per stat |
| charts.py | The four SVG charts + OG image |
| data/stories.csv | id, title, created_at, points, num_comments, url, author |
| data/comments.csv | story_id, comment_id, hours_since_post, by_story_author |
| results.json | Everything analyze.py computes, including the curves |
MIT licensed. Data is from the public Algolia HN API.